Top Five Warehouse Management System KPIs
Key Performance Indicators for WMS
How do we know if our warehouse or distribution center is running as expeditiously as possible? Accounting department touts great numbers, warehouse personnel are clearly working hard, and everything “looks and feels” right, so isn’t that good enough? You knew the answer was “no”, right? The supply chain sector is just too competitive these days for your operation to be losing inventory, wasting time with rote procedures that could be automated, having personnel performing tasks inefficiently, etc.…You must determine which Key Performance Indicators (KPIs) are directly related to the success of your business, and then track them over time in order to continuously improve from established baselines to targets. In this article we’ll look at common KPIs (and the calculations behind them) that cover inventory accuracy, customer service quality, and overall cost that you can use as a starting point when beginning the journey of building a suite of KPIs. Every warehouse has its own unique intricacies and so as you grow this suite, specific KPIs will naturally be uncovered that your team should keep tabs on. We’ve made the case for a Warehouse Management System (WMS) before, and the ability to more easily measure, track and improve KPIs is yet another reason why a serious warehouse needs one. We’ll also specify where the relevant data can be found in the latest versions (v2018+) of Blue Yonder WMS for each KPI.
Order Fulfillment Rate: Order fill rate is the percentage of orders shipped to customers from current inventory without lost sales or the need for backordering. This is a key statistic to monitor, as it covers a variety of more specific order related metrics in one and accurately reflects your operation’s ability to meet customer demand. You can also use it to help plan procurement for future orders.
Where to get equivalent information in Blue Yonder WMS: Cancelled shorts under “System Administrator -> Operational Reports” will give you a picture of orders that were shipped short and/or in backorder; “Unprocessed Demand” could also help.
Calculation: Total orders shipped / Total orders placed x 100
Shoot for: 95 percent or higher

Service Level Agreement Rate: A customer Service Level Agreement (SLA) is a performance-based contract between a business (in this case the warehouse or distribution center) and a customer that compares operations metrics during a period against an agreed upon service level, and penalizes for outcomes that deviate from it. It’s similar to the aforementioned Order Fill Rate, but adds a time element along with taking into account mistakes like a wrongly entered shipping address or a truck breaking down enroute to the customer. SLAs can be written to include a 3PL in-between the warehouse and customer. Meeting demanding SLAs that require things like a high number of orders going out via next-day shipping can be a tall order, so it’s important that both sides agree on realistic service levels. The most critical SLA performance metrics are usually the delivery service level expectations and damage rates, and drastic deviations from the specifications for each will result in drastic penalties which your business certainly wants to avoid; even worse is the potential hit to your operations reputation.
Where to get equivalent information in Blue Yonder WMS: Lookup the specific customer “Outbound Planner -> Outbound” and filter results by “Ship to Customer” to see the relevant information (allocation and dispatch dates being most critical) and compare against the SLA terms. At a high level, you can also check “Yard -> Door Activity” for any late shipments.
Calculation: SLA dependent
Shoot For: Complying to all terms and specs in the SLA

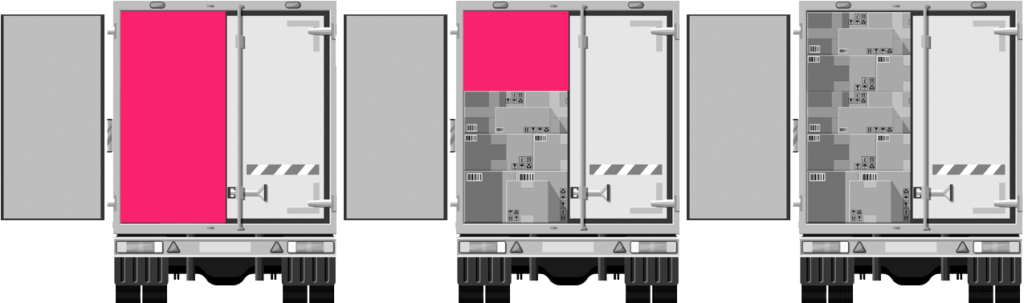
Inventory Accuracy Rate: You wouldn’t need to frequently manually count inventory on the floor if you have tier 1 WMS, but at least at a quarterly clip your team should “cycle count” and verify that your logical numbers match the physical reality on the floor. This particular check is an all-encompassing inventory stock verification, as it gives piece of mind that your warehouse personnel are properly receiving inventory, putting it away, and eventually shipping it out to customers with minimal “shrinkage”. Remember: Dedicate selected personnel for a counting team, close all transactions for inventory items prior to counting, and document every step of the way to make “discrepancy investigations” easier.
Where to get equivalent information in Blue Yonder WMS: In the “Inventory -> Counts” tab look for mismatched counts and be sure to check “Administrator -> Reports” for the Count Variance by Location report.
Calculation: WMS inventory count total / Physical count total x 100
Shoot For: 97 percent or higher
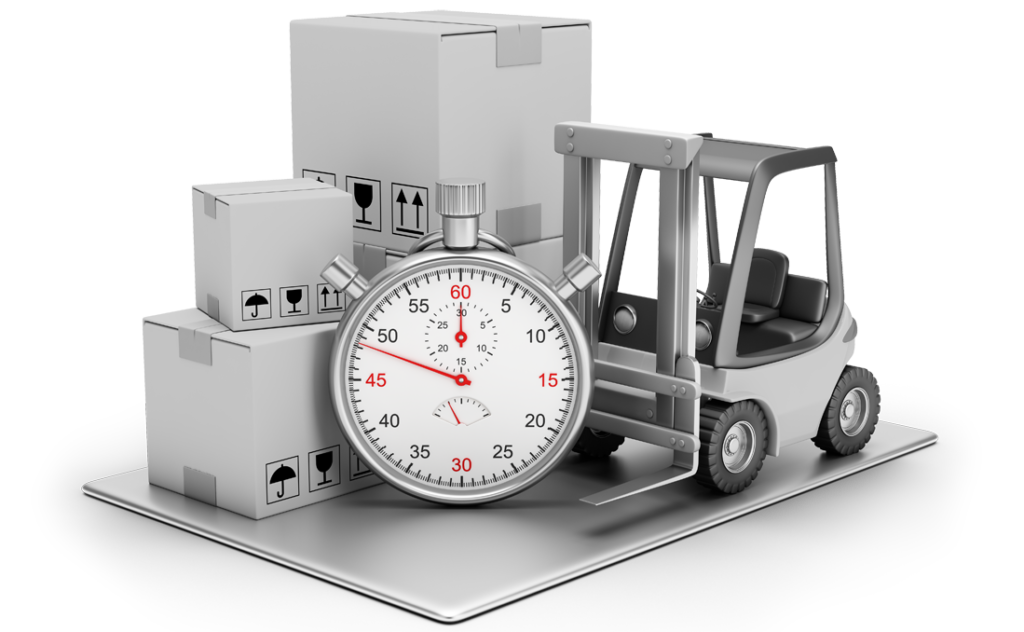
Dock-to-Stock Time: This measures the time it takes from receiving goods at the loading dock to their eventual put-away to inventory in hours. The time can include waits in a staging area, manufacturing processes, a dock worker delaying inspection to change tracks on his/her I-pod, etc.…as everything is counted with no exceptions during this time-frame. Consistently high dock-to-stock times can negatively affect other KPIs, like your Service Level Agreement rate as you can’t ship according to the agreement if you don’t have an item in stock and conversely a more efficient dock-to-stock allows for cushion to ship short lead time orders. A bad timing result can be due to something obvious like non-streamlined handling processes to trickier to nail-down issues like unnecessary paperwork.
Where to get equivalent information in Blue Yonder WMS: Check “Yard -> Transport Activity” to find the time the trailer arrived at the receiving dock, and then check “Inventory -> History” and filter by the inbound load number or receive key.
Calculation: Check the timestamp for the truck hitting the receiving dock, and then again when the inventory from that truck to reaches its storage location
Shoot For: Find a realistic target, whether per item or an overall average, and strive to hit it

Cost Per Unit Shipped: This is the ultimate judgement of your operation, and of all the KPIs mentioned it’s the largest calculation. You can breakdown the cost for the various types of units if they differ greatly, or more simply, one average for all units. The facility operating cost can take some time to properly put together as it includes all fixed costs, things like building rent and labor, as well as variable costs such as production and packaging.
Where to get equivalent information in Blue Yonder WMS: For the inventory portion of this lengthy calculation, check “Shipping -> Shipped LPN Activity” to find total number of units shipped.
Calculation: Facility operating cost / Total number of units
Shoot For: Find a realistic target, whether per unit type or for all units, and strive to hit it
What are some of your team’s favorite KPIs? Drop us a line and we’ll compare notes.
This post was written by:

Recommended Content
How to Prep and Undertake a Supply Chain Execution Go Live as a Client
You’ve chosen a supply chain execution system (WMS, WLM, etc…) along with a vendor to handle the implementation, and all parties have agreed upon on a timeline. So…What’s next? We can sit around patting each other on the back for finally bringing our operation...
Similarities between Manufacturing Supply Chain and the Human Body
What? Come on now… How can an efficient manufacturing supply chain be similar to a healthy human body? They got nothing to do with each other? One is a living organism…and one is…well…an industrial process. Actually, the count is endless. A well oiled industrial...
6 Tips to Properly Maintain Your Warehouse Management System
Your operation has successfully implemented a warehouse management system. Congratulations, as not all WMS implementations are successful – or so we hear, at Tryon Solutions we don’t have firsthand experience with that. Your next step post-implementation is ensuring...
5 Supply Chain Systems Enhancements for Consumer Goods
Line up! The battle for the top systems enhancements for consumer packaged goods (CPG) companies starts now. Every single supply chain professional has their own list of tools needed and processes required. Every organization has their inventory issues with changes to...
4 Compelling Reasons to Outsource Supply Chain Execution Services
Why would one outsource when it’s technically possible to handle everything in-house? I’m a fan of a nice haircut, and I’m willing to pay a little more to get it. Before coming to this conclusion, I tried a well-known super-cheap option out there (rhymes with...